Dynamic Dashboard Using Tableau
This was a project I started back in May,2022 when I first learned tableau. This gave me much challenges and learned a lot.
The project is based on a dataset from UK Bank. It has 9 columns having data from customer. There i haven't solve any specific analysis. It is a just overview of data aka customer to the client.
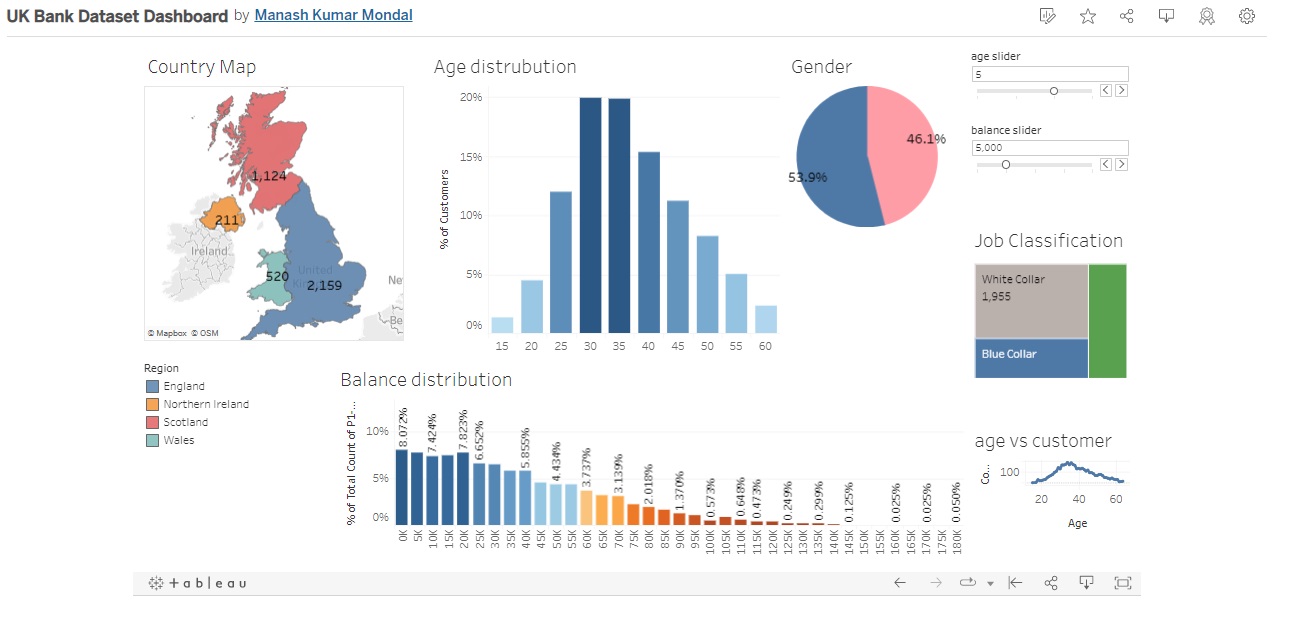
The dashboard is very dynamic. You can pick any visual to filter out the data and the overall visualiation of every analysis will be chnaged.
The dashboard contains a map, two bar charts, a pie chart,line and a tree chart. There are also two extra slider for filter out dataset according to balance and age of the customer.
Technologies:
- - Tableau
- - Excel
Details Chart
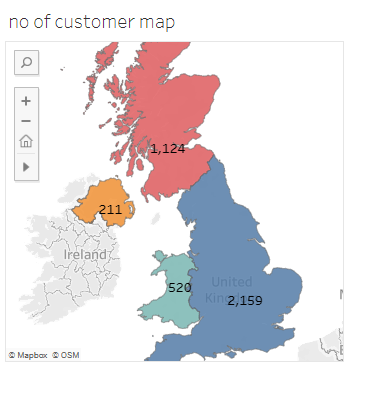
Map
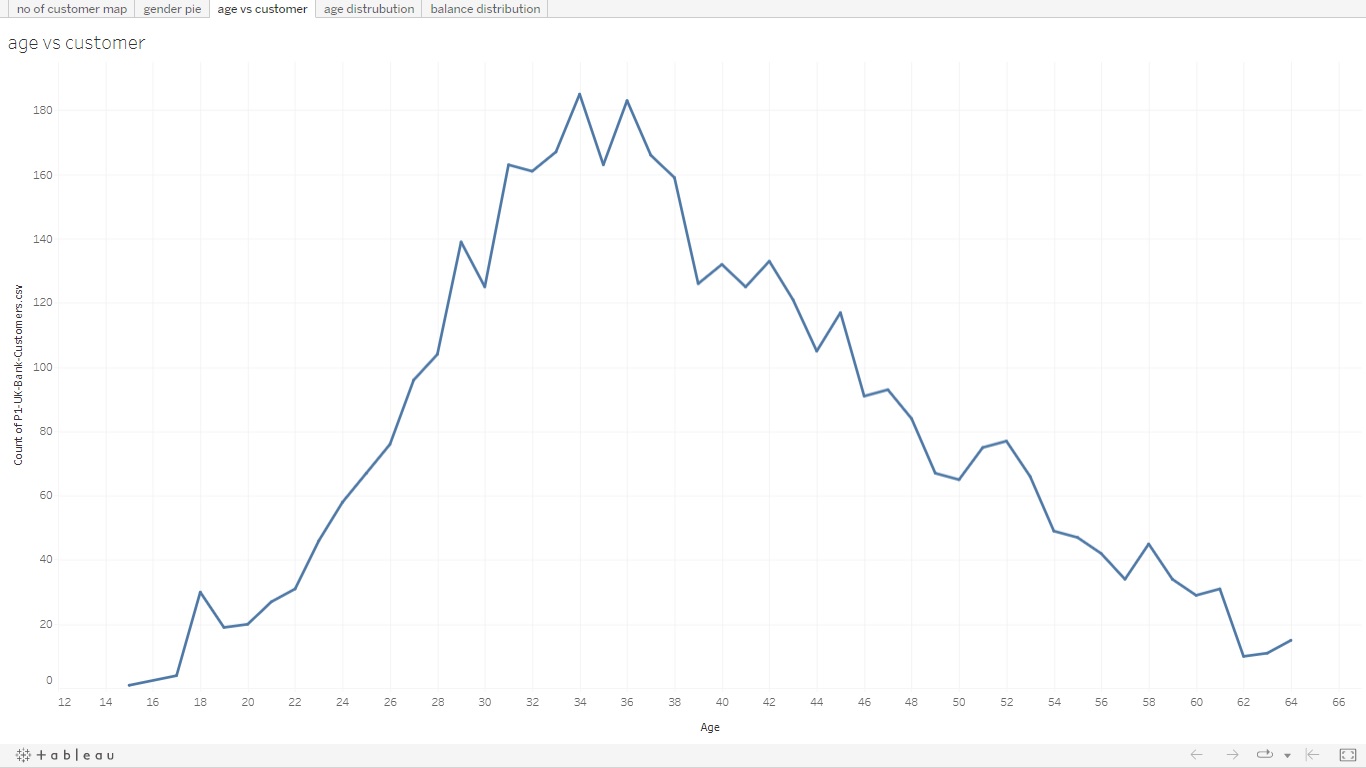
Age Distribution chart
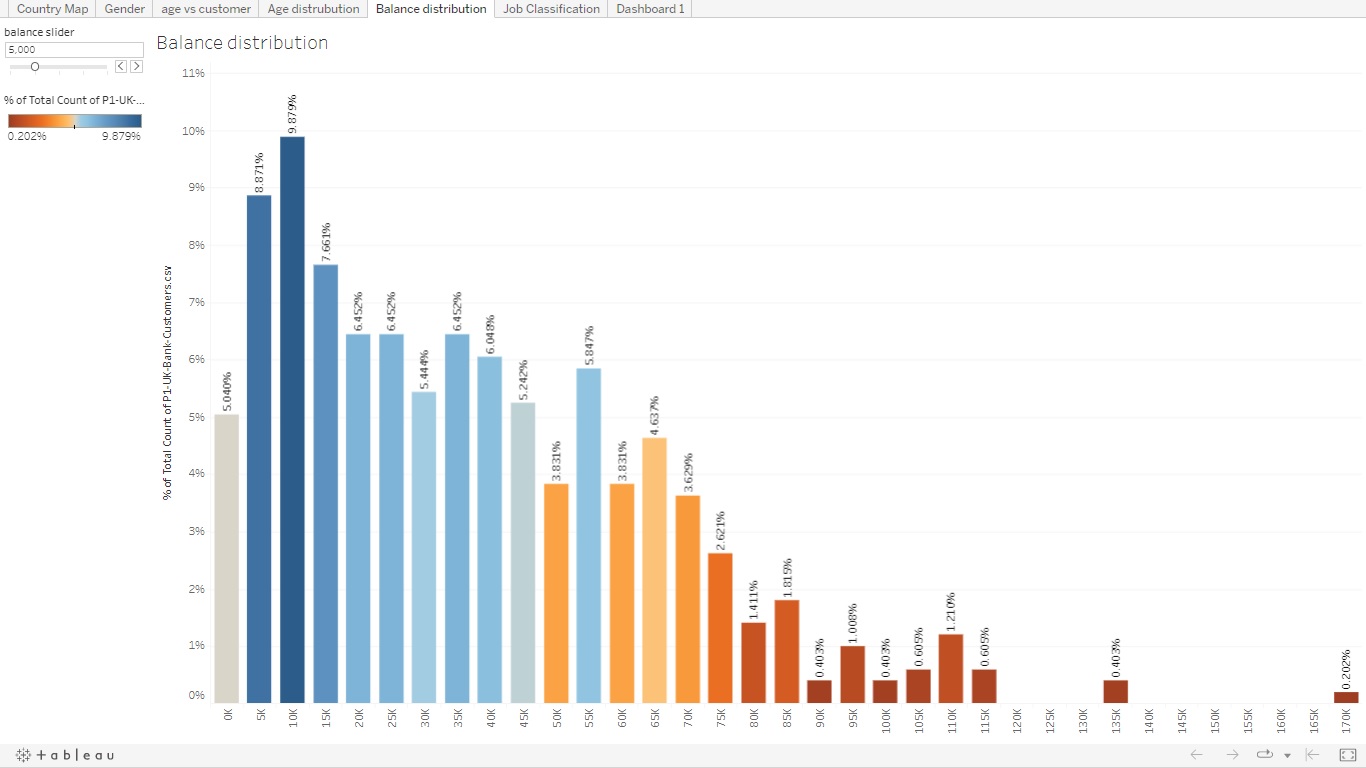
Balance Distribution